Visualizing Divvy Trips + Inequality (?) in Chicago
This page highlights the visualizations I made for the final assignment in the Spring 2023 offering of MACS 30113: Big Data and High Performance Computing for Social Scientists, at the University of Chicago. The goal of the assignment was to practice PySpark and tools to visualize big data. You can read more about my takes on these visualizations in the README file located here.
Overview
The interactive map below highlights all trips taken via Divvy in Q3
of 2018 (weirdly, just July through September). Each shaded blue area corresponds to one of the
community areas
of Chicago, and each dot corresponds to a Divvy station. Hover over a station to see the relevant statistics associated with
Divvy trips starting from that station:
- Station Name: Name of the Divvy station.
- Docks in Service: Number of bike docks in service.
- Trip Count: Total number of trips starting from station in Q3 2018.
- Trip Count (Normalized): Trip count divided by number of docks in service.
I created the "normalized" trip count measure to try to account for the fact that stations with high trip counts might be simply stocked with more bikes to ride. To create the measure, I divide a station's total trip count by the number of total bike docks available. This yields a station-level measure of bike usage in units of average trips per station bike.
Yellow and green correspond to the highest normalized trip counts, and blue and purple correspond the lowest. One takeaway from the map is that Divvy trips are the most frequent in the Loop (no surprise), and on the North Side. They are the least frequent on the South, Southwest, and West Sides of Chicago. You can read more about these geographic trends in my README.
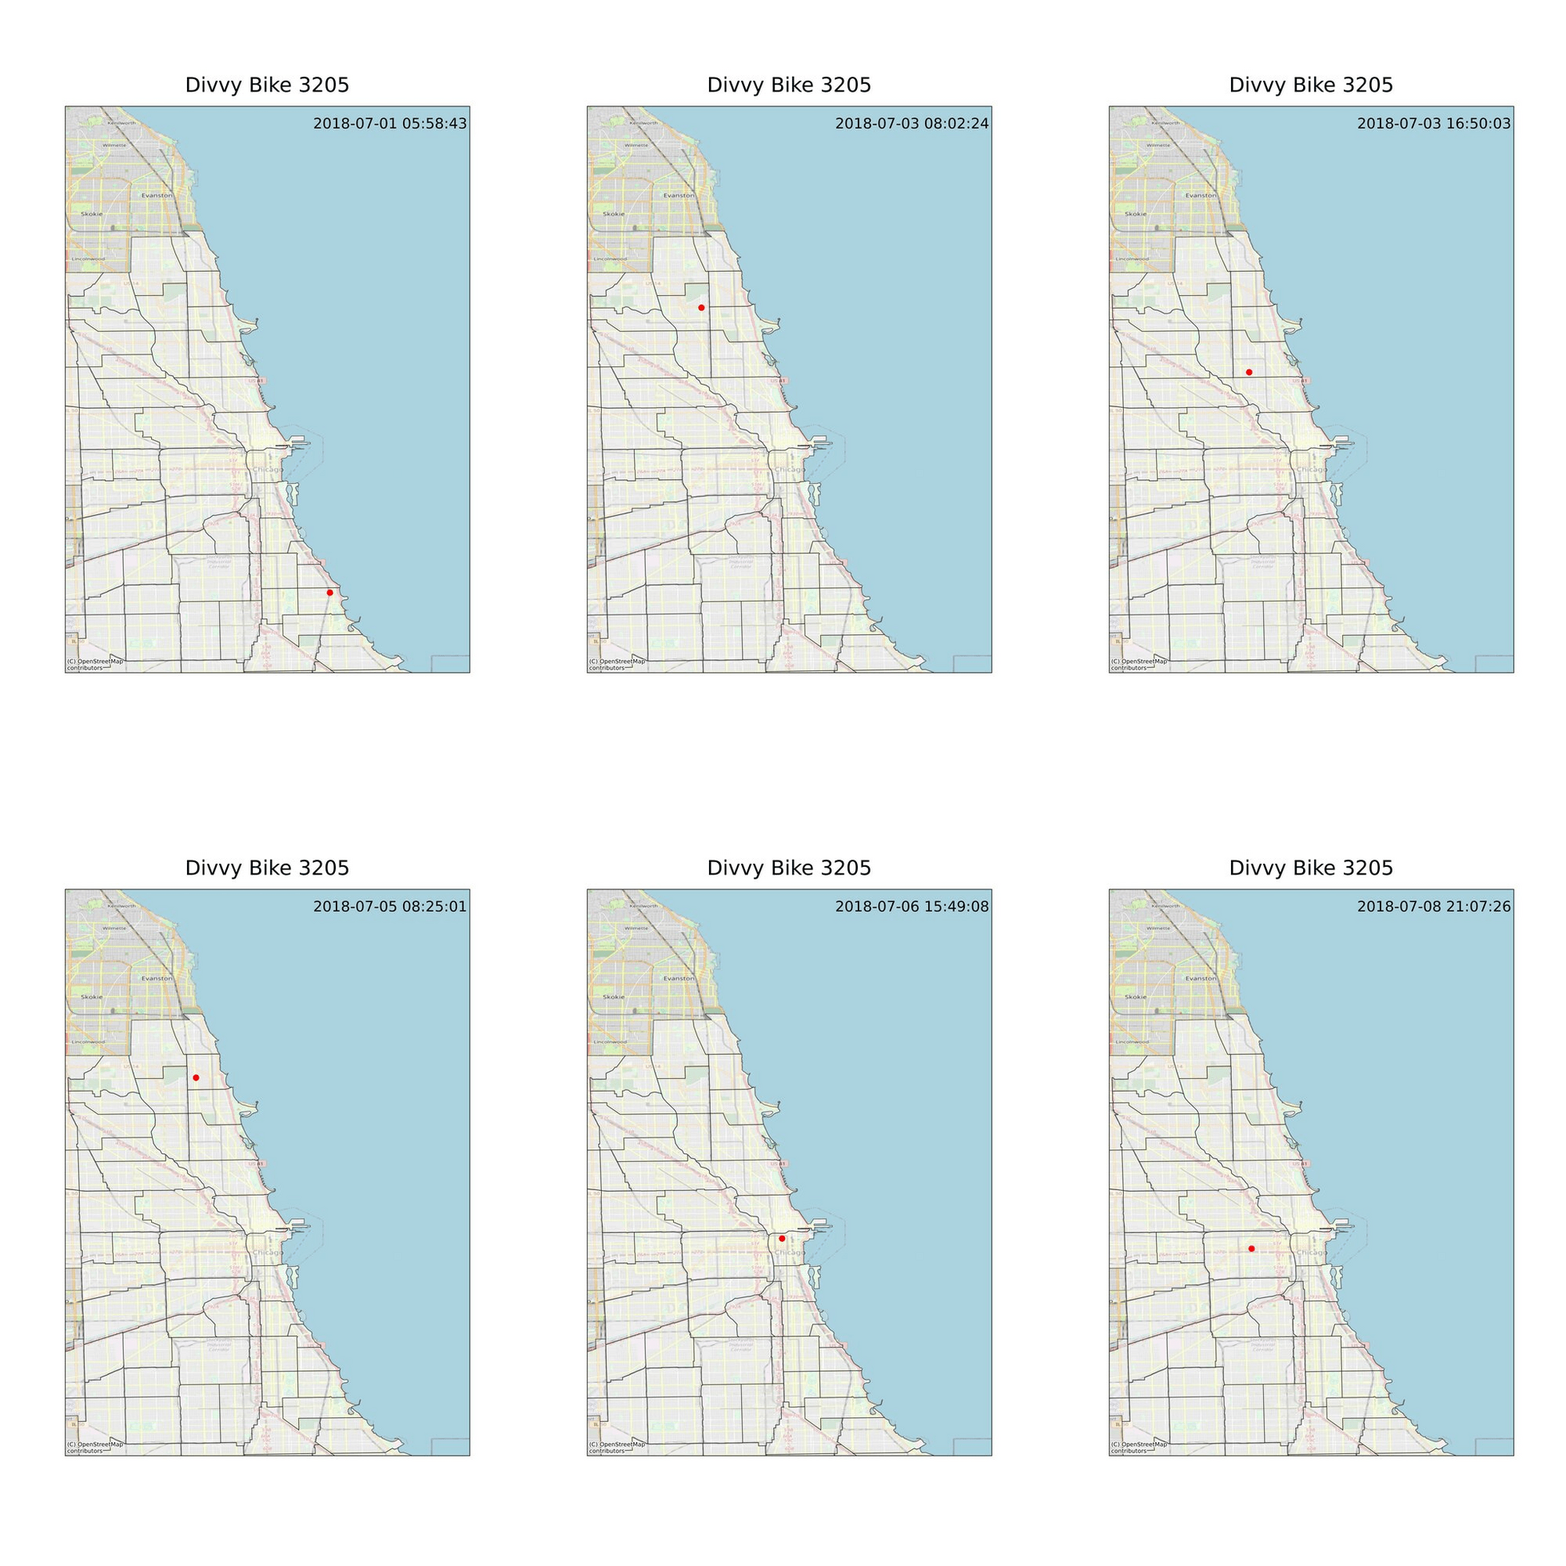
Here is an additional bonus visualization of a week in the life of an average Divvy bike. I created a timelapse gif to track Divvy bike 3205
on its journey during the week of July 1-8, 2018. I picked bike 3205 because it begins the day on July 1 by being parked at
the Ellis & 55th Divvy station, my local station when I used Divvy to commute to class during my first year of graduate school. As the visualization shows, the bike putzes around Hyde Park for a short time only before being ridden to the North Side, where it remains for the rest of the sample period.